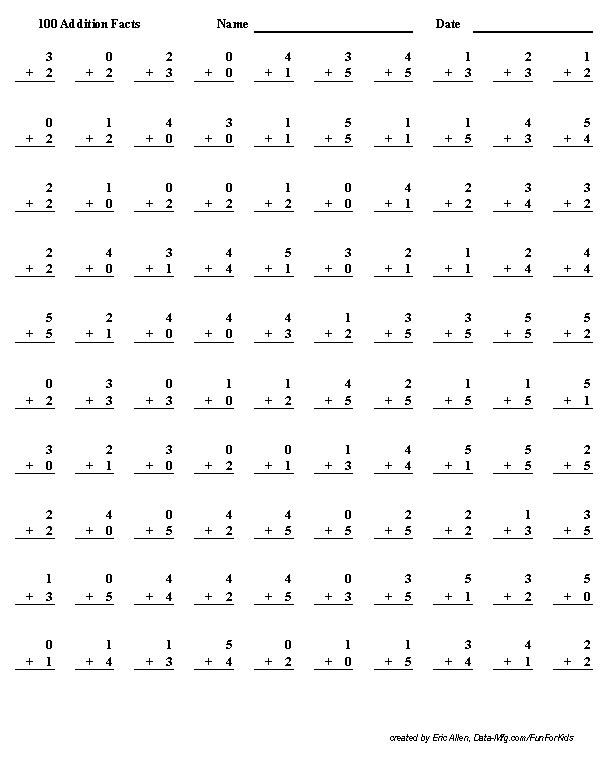
 Looking for 100 problem math tests or worksheets for grade school kids learning their math facts? Can’t find a test that is just the right level for where your child is right now? I had that problem and decided to make my own custom math fact test creator. It is an Excel spreadsheet, using formulas to generate random problems that are customized to the exact level of difficulty you need at any given time. You can print test after test, and they are never the same. Practice a different timed test every night if you want!
Downloading the File
To download the Excel file, just click here.
Navigating the File
The Excel file has four tabs or worksheets, one each for addition, subtraction, multiplication, and division. Eventually, I’ll add more stuff, but this should cover lots of possibilities. On each tab or sheet, there are 100 problems that are randomly generated, with an answer key below. If you print the tab as set up in two pages, the first page is the test, and the second page is the answer key. You can skip the answer key by just printing page 1.
Printing the Test
The sheet is set for automatic recalculation, which means after every entry you make, the problems will all be changed per their formulas for random problems. You can turn off the automatic calculation by going to the options portion of the Excel menu and making calculations manual. On most versions of Excel, you can manually calculate by pressing the “F9” key. Every time you press this key, all the problems and their answers will be changed to new problems. If you want three tests with different problems for three different nights, print one test, hit “F9”, print again, hit “F9”, and print again- you’ll get three different tests, all completely different, but the same level of difficulty.
Changing the Difficulty
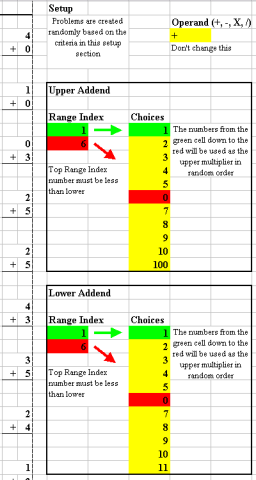
On the right side of each sheet is a colorful couple of blocks that determine the values that will be chosen from for the problems that are randomly generated. For addition, the user can choose up to 11 values for the upper addend and 11 other values for the lower addend. Then the user picks how many of those values will actually be used. On the example to the right from the Addition tab, the settings are set for a simple test, both addends will range between zero and 5, generating problems like 1+1 or 5+0 or 2+3. The “Range Index” in each box refers to the first and last index value from the “Choices” list to be used. To make this more clear, the first and last choices are color-coded. In the example, both boxes have “1” as the first “Choice” and have “1” as the top “Range Index” value. This means that the first value in the choice list, which happens to be “1” will be the top of the range of values to be used. To hopefully make this a little more clear by contrast, the last choice that is to be used is “0” which was placed in the sixth spot in the “Choices” list. The “6” in the lower “Range Index” refers to the sixth value in the “Choices” list. So, the problems will have either 1, 2, 3, 4, 5, or 0 for each addend, based on the setup. The point is that you don’t have to use numbers in order, or use all of the choices. You can pick and choose.
On each example I’m showing on the site, I’m showing one column of problems that were generated by this sheet, so you can get a feel for the connection between the setup and the result.
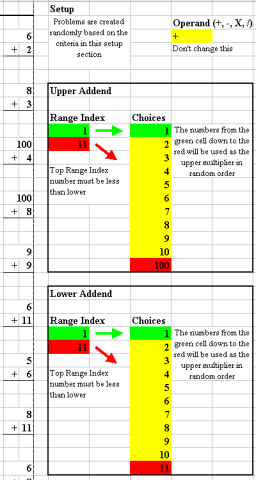
Let’s look at a tougher addition setup. Here the problems can have answers over 100. The choices are the same as before, except that 6 is in the sixth position for each list, but the range goes from the first to the eleventh value, which makes many more possibilities.
While the “Choices” lists are almost identical in these examples, you could make them completely different or even double up some numbers. Perhaps your little one is having difficulty with addition that involves eights and nines. Put 8 in place of 1, and 9 in place of 2, and you’ll have almost half of the problems with 8 or 9 in the top and almost half with 8 or 9 in the bottom. Likely 3 out of every 4 problems will have 8 or 9 in the top, bottom, or both. Make it any way you want. You’re the boss! After you put the settings you want, hit “F9” or re-calc a few times to see that you are getting what you wanted. Remember that each time you re-calc, you’ll get a different group of problems that match your criteria.
Remember that the numbers of the “Range Index” are referring to the box number under “Choices,” not the value in the boxes. Notice that the example to the left shows the bottom “Range Index” each pointing to the eleventh box, not at the value “100.”
Subtraction and Division
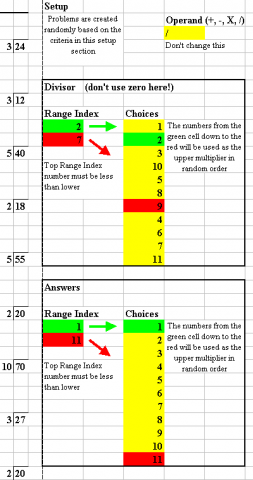
In both subtraction and division, the object is to break down a bigger number using a smaller number to get another smaller number. In subtraction, an amount (subtrahend) is subtracted away from a number (the minuend) and we find the difference, or answer. In division, the big number (dividend) is divided by the divisor to determine a quotient. For creating tests, we will pick out the small numbers and the formulas will calculate the big numbers. See the following examples:
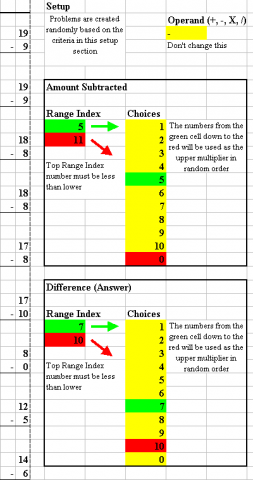
This setup on the right for subtraction is to focus on a narrow group of problems. My kids have often struggled with problems where the small numbers are in high single digits. Problems like 17-9 or 15-8 were needing more attention than the easy problems like 3-2. So, in this example, we are picking out problems that fit harder criteria. All the answers are between 7 and 10, and the amount subtracted is between 5 and 10 (or zero). You can see a sample on the far left of the problems this setup generated in one attempt. The problems can get more difficult by changing the zero to 11 or maybe slightly changing the range as you see fit.
Here are some special division setups. One teacher I know starts multiplication and division with some of the easy to remember numbers 2, 10, 5, and maybe 3. If you’re doing something similar, here’s a way to make it work. Put the numbers in whatever order you want and open the range of numbers as your kids get proficient. So you can save 42 divided by 7 and 56 divided by 8 until 16 divided by 2 is easy.
By the way, this worksheet is set up so all division ends up with whole number answers, no remainders, as long as you put whole numbers as answers. All subtraction ends up with positive numbers, unless you put negative numbers in the answer choices. As you want to get more difficult, this sheet will go there.
Multiplication
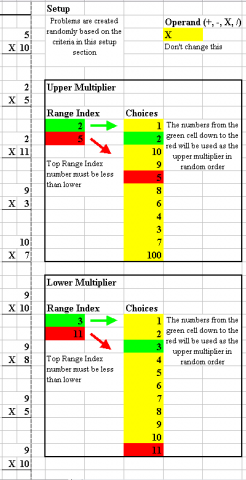
I skipped over multiplication, but it is essentially the same setup as addition. You pick the multipliers (factors). Like I mentioned in division, some teachers take facts in a little different order- multiples of nine are often easier than multiples of seven. I really don’t have anything against seven, I can easily remember that sevenths in decimal always follow the same pattern like 0.14285714285…. But that is a lesson for another day a few years down the road from these sheets. Until then, happy testing!
How it works
Without going into a lot of detail, this spreadsheet makes a lot of use of the function RAND() which was present in early versions of Excel as well as more recent ones. The formulas on each page point to the ranges and choices to get the problems and the random function does the rest. The color coding in picking the ranges is done with conditional formatting. Be careful not to delete or change formulas, or you may find that the sheet doesn’t work right any more. If that ever happens, just download a fresh copy from this website.
If you like this test creator, let me know. Drop me an email, or share this on the social media of your choice, using the icons at the bottom of the page. If you have suggestions for improvement, or find a novel way to use this, share it below in a comment for everyone else to see. I’m sorry that it requires a couple of steps to leave a comment, but I do it to keep out the spam robots.
Downloading the File: To download the Excel file, just click here.
Other Math Worksheets: I’ve recently added a file for Fraction Tests. Check it out on the Fraction Tests page. There is also a new Long Addition Tests page.



9 Responses to Math Facts