I heard someone say that he likes the Royal’s chances to win the World Series. I do too.
But can you calculate their chances? To win, the team needs to win four out of seven games. (When I wrote this in 2015, the Royals had won the first two games at home and then had five chances to win two more.)
As a manufacturing engineer, I am asked to calculate how likely it is that a machine will meet the requirements that have been defined for it. So figuring out some baseball odds shouldn’t be that hard. So here are some of the odds I was curious about. A lot depends on assumptions, but I’ll give you my answers first and then explain how I came up with them. See if you agree.
How likely is it that now the Royals will win the series? 79%
How likely is that they will sweep in four? 12% (if that surprises you, read on for my assumptions)
The next two games along with game five if needed will be played in New York. Games six and seven would be back in Kansas City. How likely is it that the Royals will come back to Kansas City? 72%
How likely is it that there will be a game 7? 33%
How likely that the Mets win in six games? 9.6% (higher than I’d like to believe)
I’ll give you more odds later, but those are my headlines. Let’s talk about how to figure these. There are a few considerations to make assumptions about and after that it is just math.
Let’s think about all the possible outcomes. With seven games, how many combinations of win-loss scenarios are there? For the first game there are two possibilities- Royals win or Mets win. For two games there are four possibilities- Royals win both, Mets win both, Royals win the first and lose the second, or Mets win the first and lose the second. For three games there eight possibilities, for four there are 16. See a pattern? Doubling every time. So for five games there are… 32? Nope. 30.
Why 30? Because there are two possibilities we have to take into account. If the Royals win the first four (still possible) or the Mets would win the first four, there wouldn’t be a game five. So, we don’t have the possibility of the Royals or Mets winning the first five, because the series is over when someone wins four.
With six and seven games, it gets more complicated. There are eight five game combinations that would end with four games to one. I’ll show you a chart shortly to demonstrate. So, 50 possibilities- double the 30 possibilities for five games and remove eight possible situations where one team wins four games to one and the two four game sweep possibilities. There are then 20 combinations where the series ends four games to two. That means we end up with 70 possible combinations of wins and losses for a seven game series.
What are the odds for each of the 70 possible combinations? For each combination, you have to multiply out each game winner possible chance of winning.
The biggest assumption is how likely it is that a given team will win each game. The easiest assumption to make would be that it is a 50/50 proposition. The calculation is fairly straight forward because regardless of the situation the math is the same. Any two game combo has a 25% chance of happening- 50% X 50% = 25%, or one out of four. How would that impact the original questions?
Let’s start with a new question- what were the odds of the Royals winning at the beginning before the series started? That should be obvious- 50%. Every possible combination has equal possibilities.
With the Royals up two games to none what is the chance they will win the series?
There would be a 25% chance they win both game three and four. There is an additional 25% chance that the Royals win in five games- actually two 12.5% possibilities. Then there is 3 more combinations where the Royals win in six games at 6.25% each or 18.75% total. And for seven games, there are four possible combinations where the Royals win at 3.125% each for 12.5% total. Add it all up and the possibility is 81.25%. There is a 6.25% chance the Mets win in six games and a 12.5% chance the Mets win in seven (the same as the Royals).
If every game is 50/50, then there would be a 50% chance the series has to come back to Kansas City.
But, is 50/50 really a good assumption? What about momentum? Or teams having their back against the wall? Starting pitching? Bullpen? Regular season record? Or home field advantage?
There are lots of possible factors that could be used, but let’s take just one and think about it. Home field advantage. Teams play very hard to get it. Home teams don’t always win, but more often than not the home team comes out on top. How much more likely? And how does that impact our calculations?
What would happen if home teams won 100% of all games. So far that is the case. If that were true, the Royals will win after seven games after the Mets win the three games in New York. But if that were true, we wouldn’t even need to play the games. The results would be certain. But we know they are not. If games were 50/50, then the scenario of the home game winning every game would be 0.8% possible, and the odds of the visitor winning every game would be the same. To calculate that, multiply 50% or 0.5 times itself 7 times.
So, I don’t think the odds are 50/50 and I’m sure they aren’t 100%. Let’s go with 75% home wins. Now, what is the possibility of the home game winning every game? 13.3%- It doesn’t happen that often, so still too high. How about 60% home wins? The home team would win every game 2.8% of the time or about once every 35 years. Seems too low. Let’s try 65% home wins. Now the odds of a home team winning every game is 4.9% or once every 20 years. Let’s go with that. You can argue with my logic, but that’s what I’m going with.
By the way, if the home team wins 65% of the time, the team that has home field advantage for the series wins the series 53% of the time. So, the Royals went from 53% probability to 79% by winning the first two games.
So here is my chart of possible outcomes:
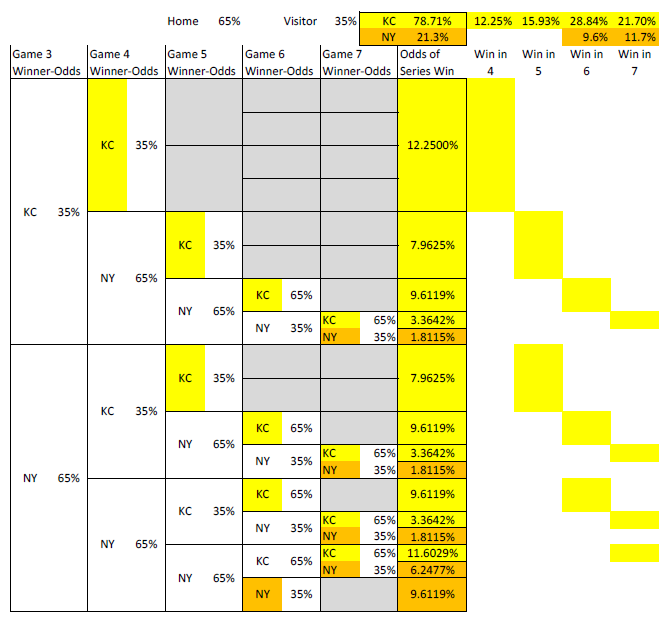
possible outcomes


